
Executive Summary
Futures trading strategies provide structured methods for identifying trading opportunities, managing risk, and making consistent decisions. Common approaches include trend following, breakout trading, pullback trading, and mean reversion. Understanding how these strategies work can help traders develop a repeatable process rather than making decisions reactively in the moment.
What Is Futures Trading?
Futures trading involves buying or selling standardized contracts based on an underlying market such as stock indexes, commodities, currencies, or interest rates. Traders use these contracts to take positions based on expected price movements or manage risk. Unlike investing in a stock, traders do not own the underlying asset itself.
A futures contract is an agreement based on the future price of a market. Common examples include stock index futures, crude oil futures, and currency futures. Futures trading allows participants to benefit from both rising and falling prices. If a trader expects prices to increase, they can buy a contract. If they expect prices to decline, they can sell a contract.
To open a futures position, traders are generally required to deposit margin, which is a portion of the contract’s value held by the platform as a security deposit, rather than paying the full value of the contract upfront.
Why a Trading Strategy Matters in Futures?
A futures trading strategy provides a framework for identifying trade opportunities, managing risk, and evaluating results. Without a structured approach, trading decisions often become inconsistent and difficult to measure. Strategies help traders apply repeatable rules so that performance can be reviewed and improved over time.
Markets move continuously, creating numerous opportunities throughout the trading session. A strategy helps traders determine:
- When to enter a trade
- When to exit a trade
- How much risk to take
- Which market conditions are suitable
A trading strategy also creates consistency. When the same rules are applied repeatedly, traders can evaluate whether a method is working and adjust it based on actual performance data rather than guesswork.
What Are the Most Common Futures Trading Strategies?
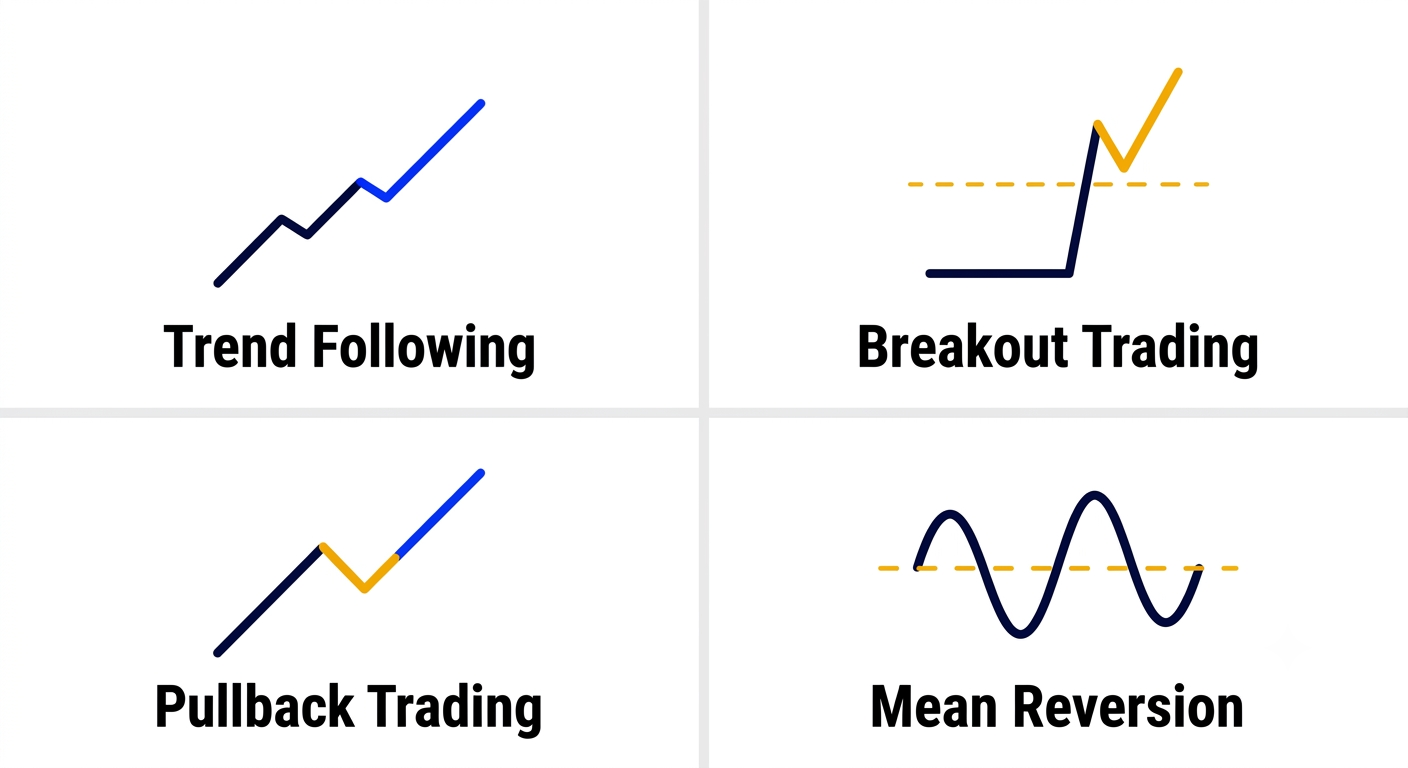
Trend following, breakout trading, pullback trading, and mean reversion are among the most commonly used futures trading strategies. Each approach is designed for different market conditions. Understanding how these methods work helps traders select strategies that align with market behavior and their individual trading objectives.
| Strategy | Primary Goal |
| Trend Following | Trade in the direction of an existing market move |
| Breakout Trading | Capture the price move after it breaks through a key level |
| Pullback Trading | Join an existing trend after a temporary move in the opposite direction to the main trend |
| Mean Reversion | Trade potential moves back toward an average price |
No single strategy works in every market condition. Traders often focus on understanding one approach thoroughly before exploring additional methods.
Trend Following
Trend following involves trading in the direction a market is already moving. Rather than trying to predict when prices will change direction, traders look for opportunities to participate in an existing move.
A trend is when a market consistently moves in the same general direction over time, either generally rising or generally falling across multiple sessions. An uptrend occurs when prices are generally moving higher over time, while a downtrend occurs when prices are generally moving lower.
To help identify trends, traders often use tools:
Exponential Moving Average (EMA): A curved line plotted directly on a price chart that follows price movements while giving greater importance to recent prices. Traders use it to identify short-term trend direction.
Volume Weighted Average Price (VWAP): A single line displayed on a fast-moving market chart that represents the average price traded throughout the day while accounting for trading activity.
When prices remain above these indicators, traders may look for buying opportunities. When prices remain below them, traders may look for selling opportunities.
Things to Watch For
- Markets do not always trend. Sometimes prices move sideways within a narrow range without establishing a clear direction, which can produce signals that do not align with actual trend conditions.
- Entering after a large move has already occurred may reduce potential profit opportunities.
- Trends can lose momentum and change direction unexpectedly.
Breakout Trading
Breakout trading focuses on identifying moments when the price moves beyond an important level that has previously acted as a barrier.
Two key concepts are:
- Support: A price area where buying interest has previously helped stop prices from falling further.
- Resistance: A price area where selling activity has previously limited further price increases.
Breakout traders monitor these levels on a chart. When price moves decisively above resistance or below support, accompanied by increased trading activity, it may signal the beginning of a stronger market move.
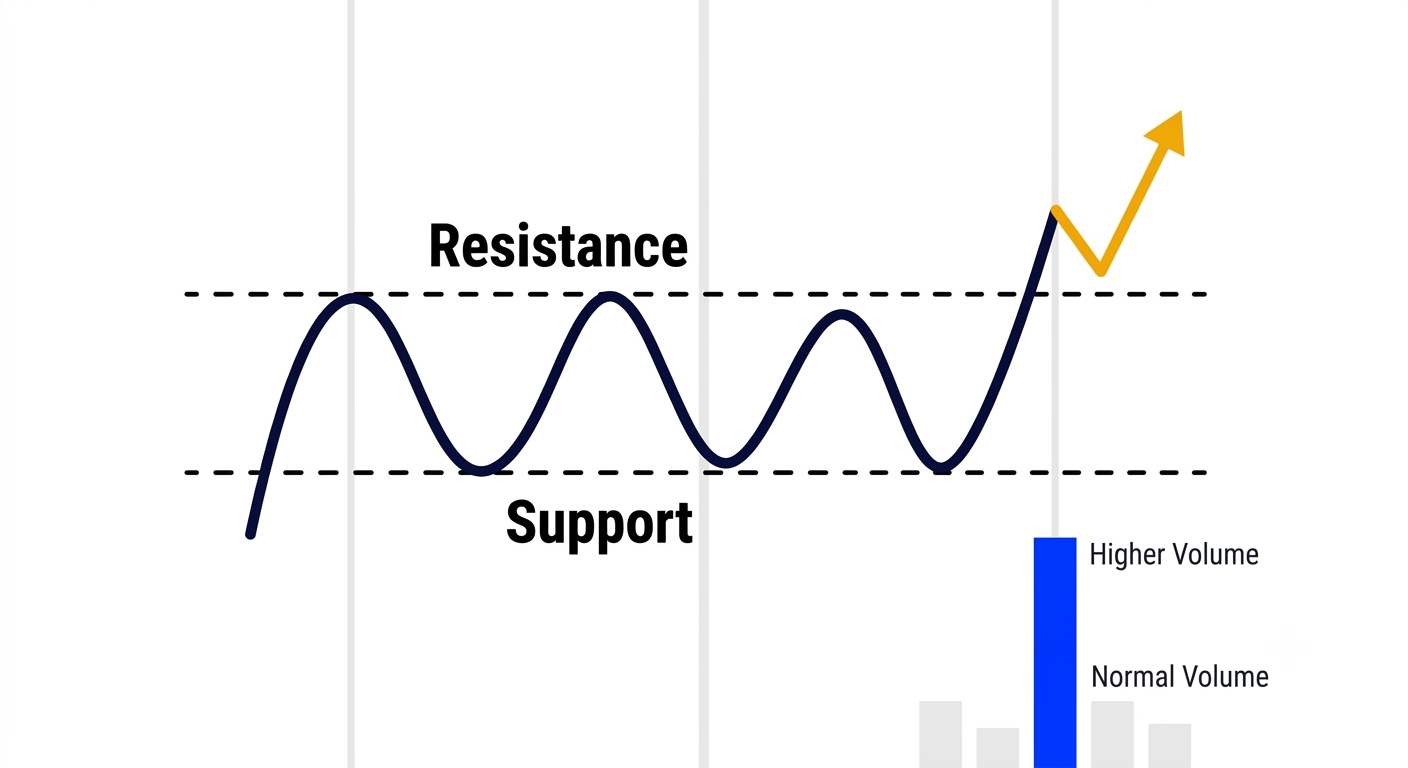
Trading volume refers to the number of contracts or shares traded during a specific period. Higher volume often indicates stronger market participation.
Things to Watch For
- Some breakouts reverse and return to the previous trading range; confirming volume and direction before entry helps distinguish stronger moves from weaker ones.
- Breakouts that occur with limited trading activity may be less reliable.
Pullback Trading
Pullback trading involves entering an existing trend after a temporary move in the opposite direction. A pullback is a short-term pause or retracement within a larger trend. Rather than entering after a strong price move, traders wait for the market to temporarily move against the trend before looking for a new opportunity.
For example:
- During an uptrend, prices may decline briefly before continuing higher.
- During a downtrend, prices may rise temporarily before continuing lower.
Many traders use moving averages such as the EMA to help identify areas where pullbacks may end, and the primary trend may resume.
Things to Watch For
- Not every pullback leads to a continuation of the trend.
- What appears to be a temporary pullback can sometimes develop into a longer directional change, which is why stop-loss (automatic exit order) placement relative to the trend structure matters in pullback trading.
Mean Reversion Trading
Mean reversion is a strategy based on the idea that prices do not always move in a straight line. Sometimes a market rises or falls so quickly that it moves significantly above or below the price range it has been trading in recently. Mean reversion traders look for opportunities where the price may move back toward a more typical level. One tool commonly used for this strategy is the Volume Weighted Average Price (VWAP). VWAP shows the average price at which an asset has traded throughout the day while also considering trading activity.
For example, if a futures contract is trading significantly above the VWAP, some traders may look for signs that buying momentum is slowing and that the price could move back toward the day’s average price. The opposite may apply when prices move significantly below the VWAP.
This strategy is generally used when prices are moving back and forth within a range, rather than during strong uptrends or downtrends where prices may continue moving away from the average for extended periods.
Things to Watch For
- Strong trends can continue longer than expected.
- Markets may remain extended without immediately returning to average levels.
Conclusion
Futures trading strategies provide a structured way to approach the markets by defining how opportunities are identified, how risk is managed, and how performance is evaluated. Whether using trend following, breakouts, pullbacks, or mean reversion, long-term development typically comes from consistent execution rather than constantly changing methods.
For traders interested in applying these concepts within a structured evaluation environment, programs offered by Apex Trader Funding can provide an opportunity to practice strategy execution, risk management, and performance tracking while focusing on process-driven improvement.
Disclaimer: Futures trading involves substantial risk of loss and is not suitable for all traders. Past performance is not indicative of future results. Only risk capital should be used.
FAQs
What Are the Most Common Indicators Used in Futures Trading?
Volume, Exponential Moving Averages (EMAs), and Volume Weighted Average Price (VWAP) are among the most commonly used indicators in futures trading. Traders use them to evaluate trend direction, trading activity, and price positioning relative to the day’s average trading level.
What Are Common Futures Trading Mistakes?
Common futures trading mistakes are typically related to position sizing, risk management, and strategy consistency. Because futures use leverage — meaning a smaller deposit controls a larger market position — the size of each trade relative to the account balance matters significantly. Keeping each trade within a defined percentage of the account and following a written plan helps manage this relationship effectively.